

Rising rates is no longer a “what if”. The U.S. two-year yield year-to-date is seeing the biggest single-quarter rise in nearly 40 years. We have seen a drop in the bond market of 11% from the most recent peak. That is the biggest drop in the last 20 years. Greater than during the 2000 or the 2008 crises.
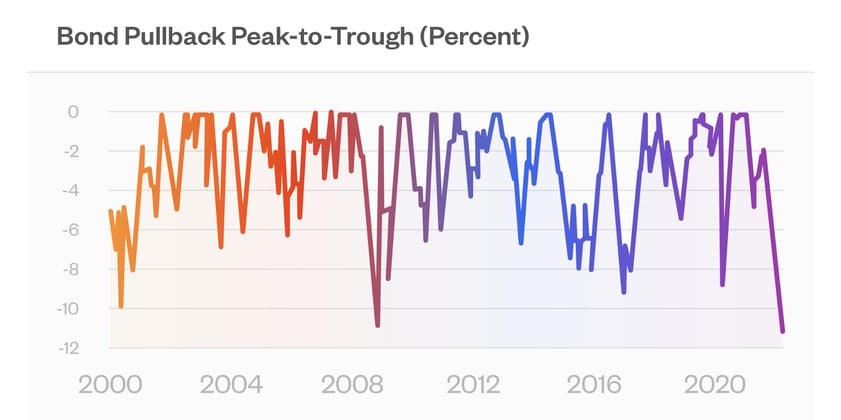
Source: Bloomberg Global Aggregate Index via Financial Times
And we are just getting started. Fed chairman Powell has signaled a hawkish stance on rates to deal with inflation. The same is happening in central banks of the UK and the EU.
This is the biggest market risk now in light of inflation and the well overdue sunsetting of the Fed’s decade-long experiment with quantitative easing. It is not only a risk because of the possible drop in bond prices, it is a risk because of our risk expectations: (1) bonds are incorrectly assumed to be safe; (2) rates have pretty much done nothing but go down over the past 25 years; and (3) credit risk, an adjunct to rate risk, is often put on the back burner because it is not evident in the day-to-day moves in the market.
1. Bond Risk
On the first point: Safe bond investments are actually risky. Don’t be surprised by a scenario where the price of a 10-year Treasury is down 20% or more. This is a trigger for P/E ratios to move back down to earth — which of course means stock prices dropping. Our generation-long bull market for Treasuries is at a close.
Treasuries rates have been in a secular decline since the mid-1980s. If you were long TBonds, for the last 40 years or better yet, long and levered TBonds, you enjoyed pretty much non-stop profits. And I know some funds that made their reputation simply by doing that — plus doing some other stuff on the side that amounted, relatively speaking, to noise.
Since the late 1960's rates of 7% and above have been the norm. We have been below 7% only since 2000. That rates have done nothing other than go down seemingly forever is a bit of an illusion, because our eye goes to the horrific rates in the early 1980s, before Volcker took the helm. (Of course, that was during a period of inflation, so no surprise.)
It is more like rates were around 7% or 8%, then exploded to double digits, and then came back to earth. We have been below 5% only post-2008. What else has happened post-2008? The Fed’s experiment with quantitative easing, when it quadrupled the money supply in just a few years. (After Covid hit, it printed more money in a few months than it had in the past two centuries. That might have been needed to keep the financial system from collapse, but it leads to inevitable results nonetheless.) It looks like that party is about to end. As it should, because although It has been the norm now for a decade, it really is an experiment, not a policy,
A footnote: Why does a rise in rates affect the P/E ratio. Well, it actually shouldn’t have much of a direct effect, but there is an argument — a justification, really — for the high P/E level that comes with lower rates, namely that the far-off earnings are not discounted as much, and so count for more on a present value basis. I don’t buy that, because the dividend discount model and Finance 101 courses notwithstanding, in real-life investors don’t put much stock in earnings that are 15 or 20 years out. But if you do buy that argument, higher rates mean a lower P/E.
And then there is where the rate risk intersects with equity risk: Credit. The corporate bond market, especially high yield and private credit, will be at risk because they are affected by the rates rise as well as by the prospect of higher defaults. Defaults are more likely when the cost of borrowing is higher and when there is earnings weakness, which is manifest in equity declines.
2. Rate Myopia
I call the view that rates won’t ever go up again, the view that the range of rates today represents the way the world is supposed to be and will be for decades out, Rate Myopia.
Sometime over the next 50 years, AI might lead to the end of work; sea levels might swamp our cities; we might have a war with Russia or China; globalization might give way to Balkanization. But rates will never again go over 10%. And 3%, plus or minus, is where rates will be.
Critical commodities (and who knows which those will be) might fall into control of, and be shut off by our enemies (and who knows who they will be). But rates will never again go over 10%. And 3%, plus or minus, is where rates will be.
Rate myopia is common today. But as we look around today (as opposed to, say, a week ago) we see that things can change in surprising ways. And the interest rate regime can change as well.
If you take the long term interest rate assumptions from JP Morgan, BlackRock, State Street, or Horizon, it looks like rates will stay low out 10 or 20 years. Everyone is entitled to their opinion, but as a risk person, I come back to, “who knows?“. That’s why it’s called risk.
If you are developing a risk model for rates, the first thing you need to do is generate paths. The top chart is the rate myopia chart. It shows two sample paths for rates from a simulation assuming the future looks like the post-2008 period. The bottom one shows two paths from a simulation that uses the rate history over the past 60 years for its calibration.
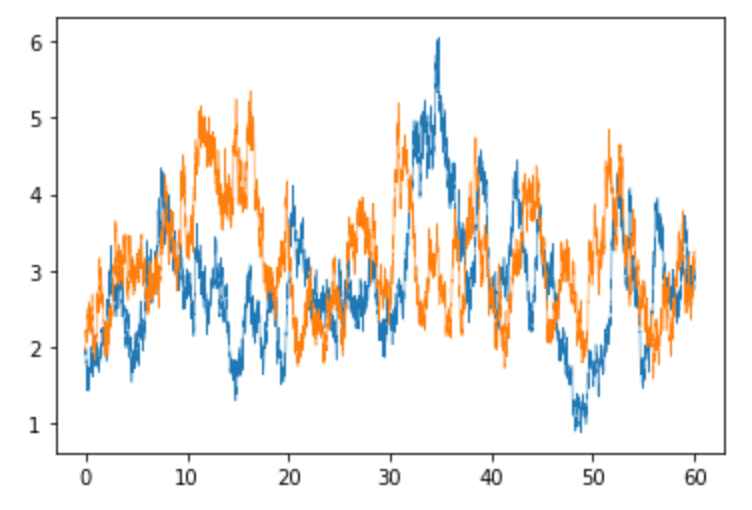
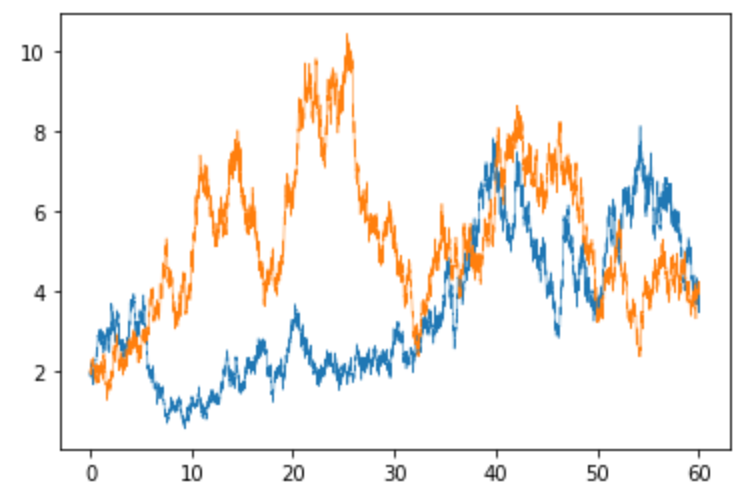
Source: Fabric Simulations
Most people I talk to go with the post-2008 period. After all, think of all the weird stuff that happened before then. Take the 1970's to the early 1980s: War, inflation rolling into stagflation, oil crisis, change in Fed regime. Old history.
As we look out over the next decades, let’s take the idea of war, inflation, stagflation, oil and commodity scarcity, and a change in Fed policy away from QE off the table. Then, how bad can things possibly get? 😊
I have no specific opinion on where rates will be at any point in the future. But I would be remiss as a risk person to not concede that they can go quite high at some points over the next 60 years. Or that they can on average be higher than they have been in the recent past.
We have to model rates to include the case where rates can take a path with the sorts of extremes of the past 50 or 60 years. After all, we’ve seen it; indeed, it is the only path we actually have seen. From a risk standpoint, it would be hard with a straight face to say, “Well, that is what really happened, but nothing like it will ever happen again”.
3. Credit Risk
If there is a credit event, there is a lot of room for credit investments to run off the tracks. When you take inflation into account, the rates for corporate bonds are at an all-time low. Even without an inflation adjustment, they are near the all-time low. You can see this in the two charts accompanying this post. First look at nominal bond yields in the top panel, then move them down by some measure of inflation from the bottom panel.
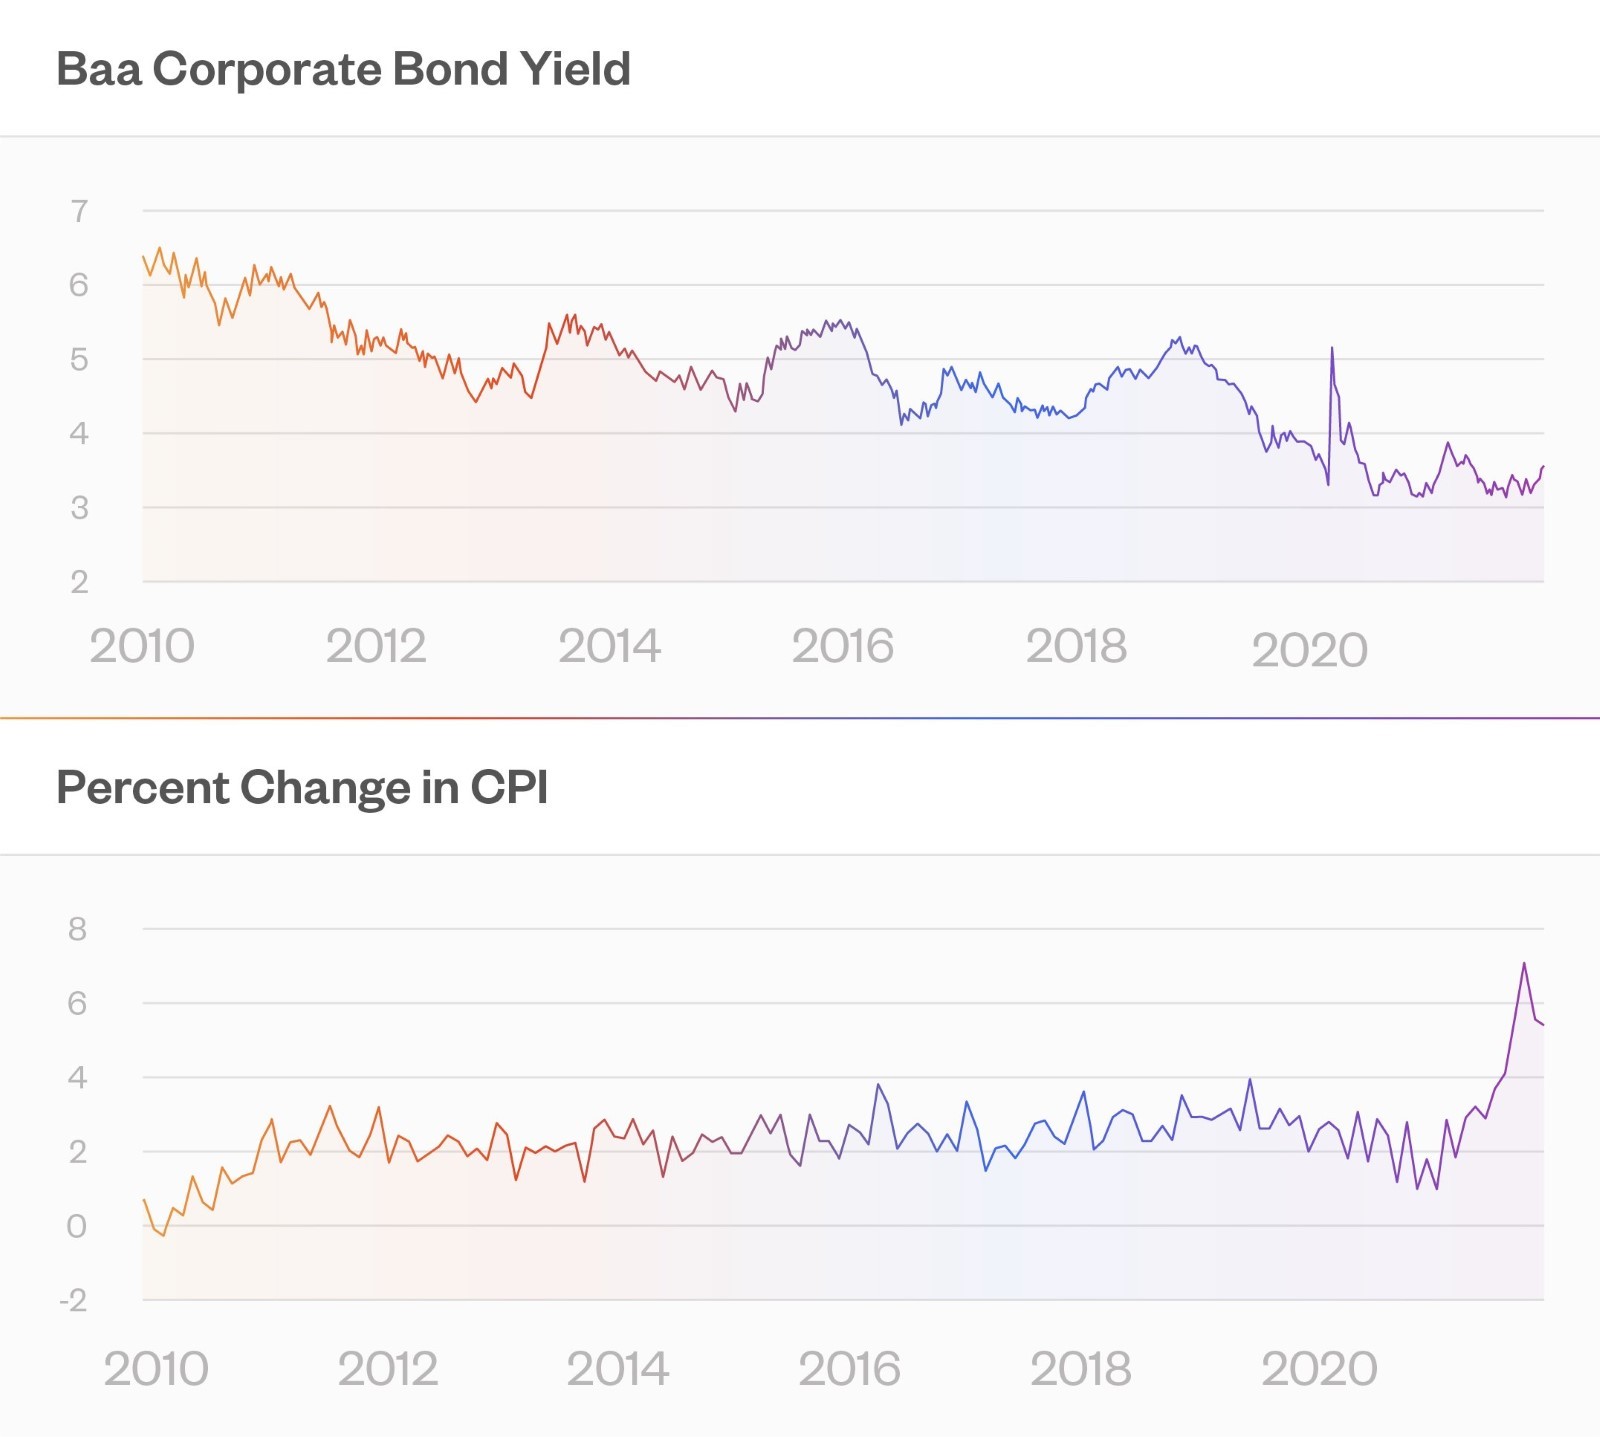
Source: FRED Federal Reserve database
If the world returns to a rational footing corporate rates, especially in the high yield bond market, are going to rise substantially. “Substantially” can mean huge spreads over Treasuries. During large credit dislocations we have seen high yield spreads widen into double digits. Which of course means big losses for the bond holders. It also means a markdown for credit exposure elsewhere, but is most manifest in the high yield bond market because that is where you can get a mark-to-market for credit risks.
But you don’t even get a good read on risk there. The volatility in the bond market does not do a great job of manifesting risk because credit risk is of the “make a little…make a little…lose a lot” sort. Most of the time things look fine. Not much happens, volatility is low.
By the way, the total size of credit risk exposure is not fully evident because some of it resides in private equity. Private equity has become increasingly populated by private credit deals. Private equity has seen a reduction of returns due to more money competing for opportunities, and so has turned more into private equity/credit. Often with the credit exposure opaque.


