No Matter What People Tell You, the P/E is on Orbit Trajectory
There is an argument out there that the P/E is not so high, because rates are low. True if you use some academic valuation models. Not true if you think we have a world that might change over the next decade or two.
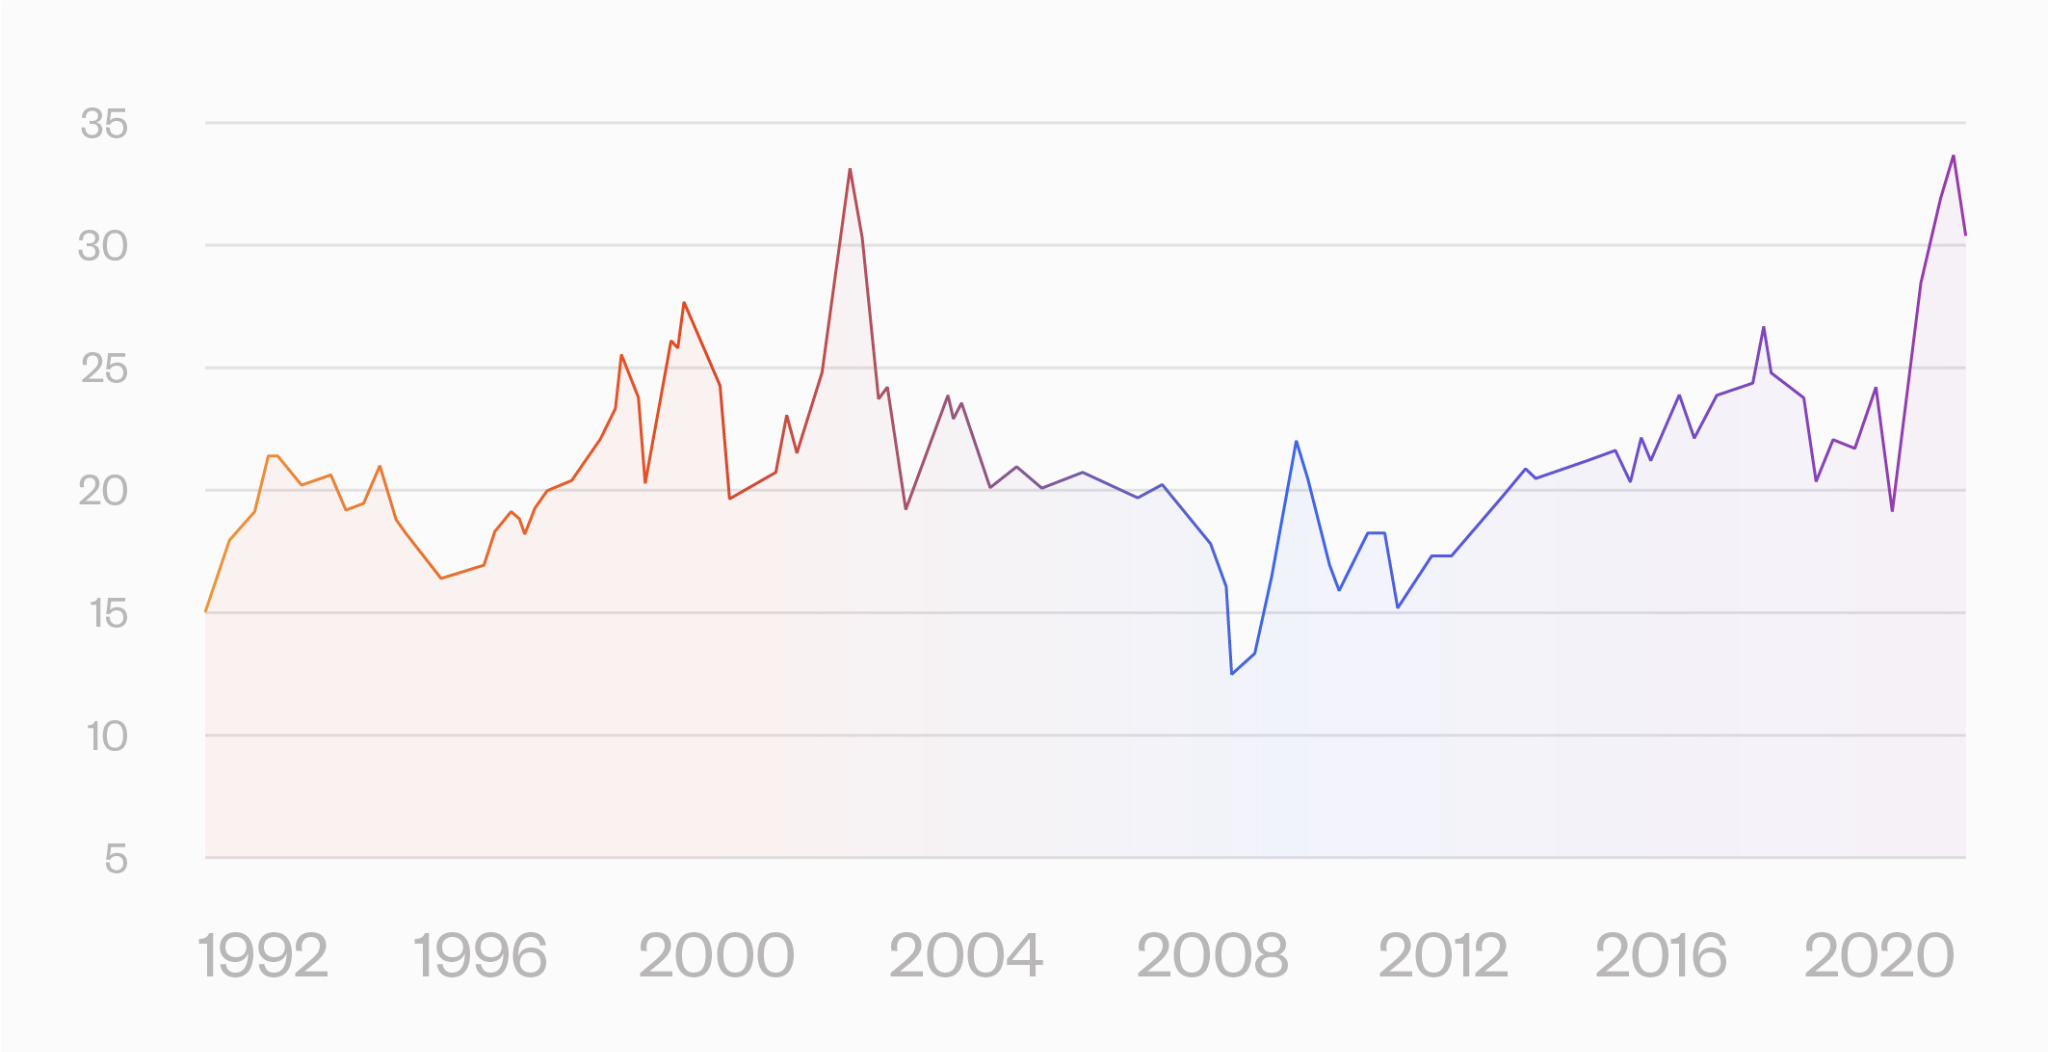
The graph below is the median P/E for the S&P 500. A historical high; code red for overvaluation and market risk. The other time it was in this range Greenspan coined the term irrational exuberance. Then we had the early 2000's.

But, during times of irrational exuberance, there is always an argument for why something negative that should matter really doesn’t, and the argument now for why we can ignore the high P/E is that interest rates are low. Low rates means the discount of forward earnings is also low. So the argument goes that in today’s market earnings that are, say, 20 years in the future matter, whereas they are discounted into near oblivion if rates are high.
Fair enough, if you are coming at this fresh from your introductory finance course and still have a good grasp of the dividend discount model lecture. But in practice, we know better than to take any projection of earnings seriously if it reaches out 20 years. Who knows what the world will look like two decades out; who would depend on earnings — much less on growth in earnings — going out that far.
The payback period — how long it takes to get your money back from an investment — is a popular heuristic for that very reason, even though it doesn’t make sense from a formal standpoint.
When rates are high, the issue with earnings far into the future doesn’t come to the fore, because they are discounted in any case. But with very low rates, we have to face the uncomfortable fact that these earnings are nothing to depend on when assessing fundamental value.
This is nothing new. In 1989, Salomon Brothers — I was the chief risk officer there a few years later — was talking up the Japanese stock market, where the P/E was north of 60. Their argument? The rates in Japan were so low that a PE of 60 still meant undervaluation. Of course, shortly afterwards the market epically ruptured. And with the dot-com bubble, the P/E ratios were explained away by saying that standard accounting methods no longer made sense; we were in a new era.
We already know that the market is vulnerable from a technical standpoint; concentration and leverage (such as margin debt less free cash balances) are very high.
So, the point remains that now we have the P/E ratio on an orbit trajectory. And you can pick many flavors for P/E, or pick other metrics like price to sales and get to the same end. Protestations and caveats notwithstanding, this is a symptom of a market that is vulnerable from a fundamental standpoint.
Access a better way to understand and work with risk, powered by MSCI’s factor model.

Rick Bookstaber
CO-FOUNDER AND HEAD OF RISK
Rick Bookstaber has held chief risk officer roles at major institutions, most recently the pension and endowment of the University of California. He holds a Ph.D. from MIT.
Access a better way to understand and work with risk, powered by MSCI’s factor model.
© 2022 Fabric Risk


