

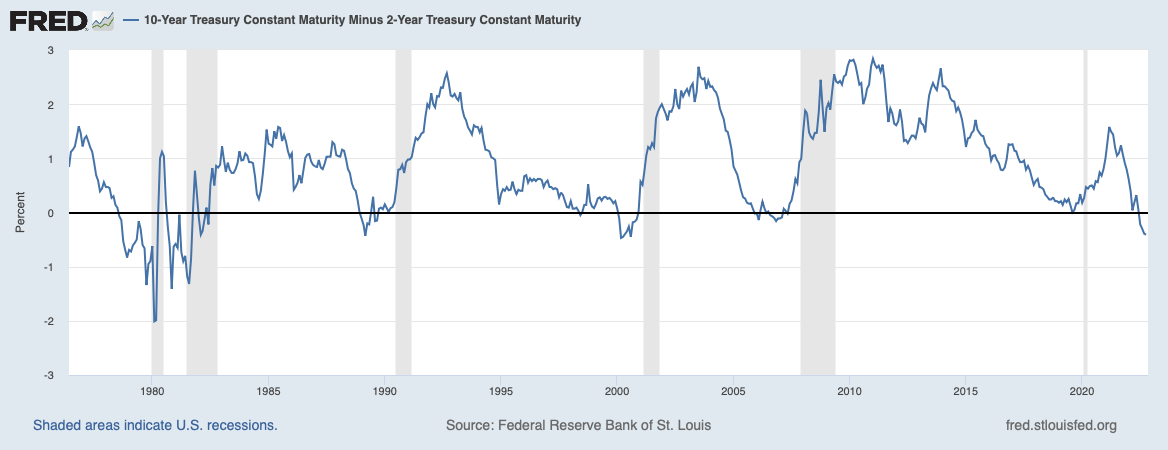
The Fed raises rates, the yield curve flattens. Finally it starts to head downhill. That’s happening. Not a good sign, because an inverted yield curve and recession go together.
Investors tuck in their tails, they aren’t as willing to take the higher risk of longer bonds when economic uncertainty looms. Also, they want the liquidity of bonds that are closer to maturity in the face of the economic uncertainty.
The inversion doesn’t cause a recession. It is a common sense relationship, and one that we have seen historically. It is one way investors express their views, so we use it as an indicator. The figure shows this pretty remarkably for the spread between the 10-year and the 2-year Treasury. The same thing for the 10-year Treasury versus the 3-month Bill.
A few things to keep in mind:
There is no magic to the notion of a recession. It basically means the economy is not doing well. There is not an either/or between things going well if there isn’t a recession, and things going terribly if there is.
Specifically, a recession is called by the Business Cycle Dating Committee of the National Bureau of Economic Research (NBER). There is no strict quantitative rule. They look at various indicators and make a judgement on whether there is “a significant decline in economic activity that is spread across the economy”:
The stock market drops when there is a recession. Sure. It also drops when there isn’t a recession. I can only add one chart to this post, but here is a link to a chart from the Fed that looks at the stock market versus recessions: https://hubs.ly/Q01rgC0D0
It sometimes drops before the recession hits, because stocks move based on expectations. And we already have had a sizable drop, so who knows how much more air is left in the balloon.
The link between yield curve and recession is based on a small sample. Even smaller if you ignore the yield curve dipping negative briefly in August, 2019 and the subsequent recession of sorts in February and March, 2020. That was due to a pandemic that no one would have anticipated. And you might want to ignore the two in the early 1980's, because rates were going crazy for all kinds of reasons. If you handicap those, you have three observations.
Here is the stock market versus recessions:
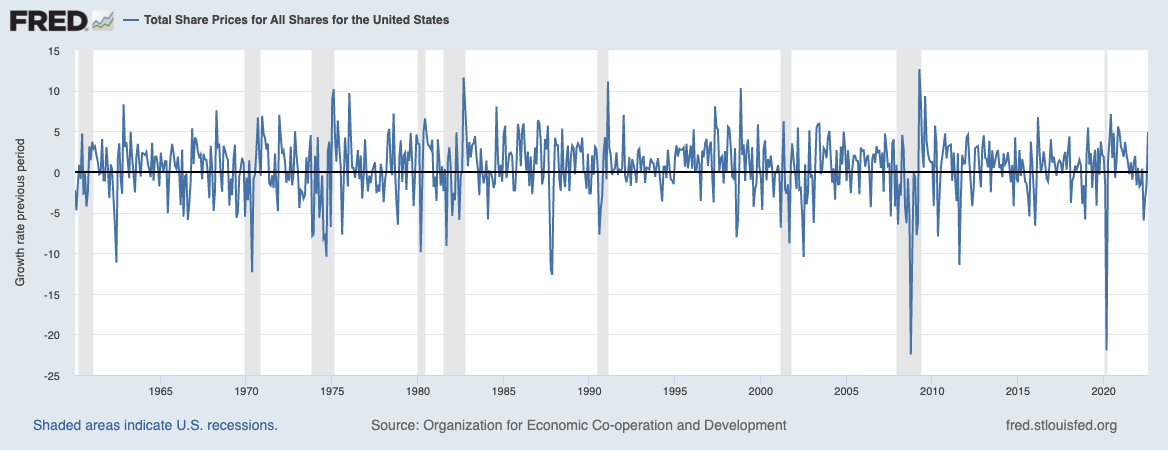
Note: In the chart with this, the Fed uses total share prices, so the amount of the drop is not what you might expect. If you use the more common index, the S&P 500, the average drop is around 25%. Which, by the way, is about where we are now.
Does it feel like we are near recession?


