Now vs. 1970s
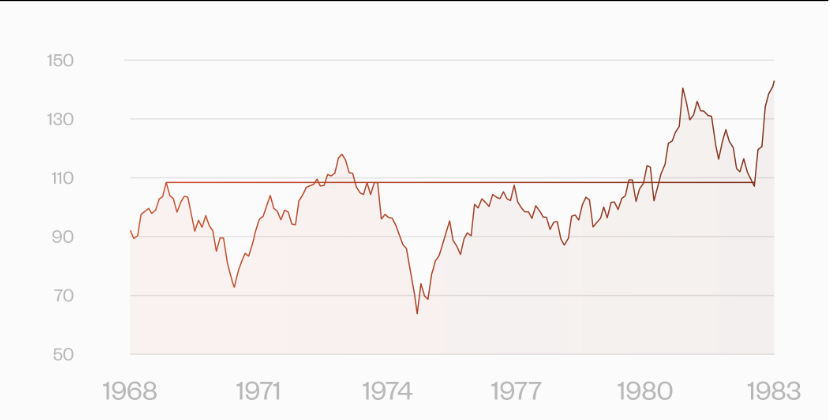
As we worked through all of this turmoil, the level of the S&P 500 we saw in 1968 did not return for good until 14 years later, in 1982.
We are seeing war, inflation, murmurs of recession. We have markets tipping over the edge in terms of P/E or P/S, even with the recent correction; rates shifting into reverse after a secular decline of 40 years. Can history give us any clues of what to expect from here?
Maybe.
Unfortunately, the period with the most similarity to now is the 1970s. That is a decade in which we saw wars that led to commodity shocks, which led to inflation, followed by recession, capped with skyrocketing rates. And through it all, a sustained stock market downturn from a period of “irrational exuberance”.
The result? Check out the chart. As we worked through all of this turmoil, the level of the S&P 500 we saw in 1968 did not return for good until 14 years later, in 1982. So we had more than a lost decade of equity appreciation.

For more on the 1970's, here’s a blow-by-blow. See what you think rhymes with what is happening today:
A burst. in the Nifty Fifty. Many spotted P/E ratios north of 50.
Two geopolitical disruptions: The 1973 Yom Kippur War, and the 1979 Iran revolution. (There was also the Vietnam War, of course.)
Which led to two oil shocks. Oil was a far more critical commodity than it is today, and the price change was far greater than anything being anticipated today.
This helped to fuel inflation. Most memorable meme: Ford’s 1974 WIN buttons. (Whip Inflation Now).
A recession, which in combination with inflation made it difficult to navigate with the monetary policy tools of the period. Sort of requiring keeping one foot on the break and the other on the accelerator.
All culminating in the skyrocketing rates. The U.S. 10-year went into double digits in 1980, peaking a year later at over 14%. This led to a shift in the Fed’s monetary regime under Volcker. (Which might rhyme with a move from quantitative easing today. But that’s something to talk about another time.)
An important lesson from the 1970s is that events can come into play from different points, one after the other, playing on the vulnerability created by the ones that came before.
This is also a lesson from the dot-com bubble and the 2008 crisis. These were not two events. They were the interaction and sequencing of multiple events, each making the following ones all the worse. The Nasdaq initially dropped about 30% without much movement in the S&P 500. Then the wind came out of the market overall, and the broader market dropped for another leg down. After that came the earnings scandals of Enron and friends, which caused yet another drop. The same is true with 2008. There was Bear Stearns, mortgages, banks, and before the dust settled, the European credit issues.
I think of the 2000’s like an episode of the TV show House. Someone comes in with a mystery ailment. As it that’s bad enough, over time it leads to yet another; one organ failure after the next, usually occurring just before each commercial break.
Those doing their financial planning in 1968 were in for a big disappointment. When they arrived in 1982 they had a stock portfolio that hadn’t changed in the past decade and a half. (Not to mention what would happened to any 30-year Treasuries they held!) The same has happened more recently: We had a lost decade from 2000 to 2014. That is, only in 2014 did stocks head up for good from the levels of 2000.
For long-term investors, the best advice is to sit on the sidelines during market downturns and crises, because over the long run equity returns are strikingly steady. But ten or twenty years is not long term enough.
If you are flat for 15 years, you aren’t really flat. Because your financial plan is based on an assumption of positive equity returns. A standard assumption is something like 7%. If instead of 7% a year you get 0%, at the end of the decade plus you might be down over 50% from where you had expected to be.
Access a better way to understand and work with risk, powered by MSCI’s factor model.

Rick Bookstaber
CO-FOUNDER AND HEAD OF RISK
Rick Bookstaber has held chief risk officer roles at major institutions, most recently the pension and endowment of the University of California. He holds a Ph.D. from MIT.
Access a better way to understand and work with risk, powered by MSCI’s factor model.
© 2022 Fabric Risk


