Rate Myopia
The biggest risk is the one you don’t think about. So, in that vein, what is the biggest risk to financial markets laid bare from the events in Ukraine?
Rate myopia is the view that the range of rates today represents the way the world is supposed to be, the way it will be for decades out.
Think about this, sometime over the next 50 years, AI might lead to the end of work; sea levels might swamp our cities; we might have a war with Russia or China; globalization might give way to Balkanization. But rates will never again go over 10%. And 3%, plus or minus, is where rates will be.
Nuclear fission might lead to free energy; demographics might change due to forced migration from global warming or migration to alleviate the economic effects of lower birth rates; cryptocurrency might become the standard, with Fed policy then toothless, even totally irrelevant (?). But rates will never again go over 10%. And 3%, plus or minus, is where rates will be.
Critical commodities (and who knows which those will be) might fall into control of, and be shut off by our enemies (and who knows who they will be). But rates will never again go over 10%. And 3%, plus or minus, is where rates will be.
Rate myopia is common today. But as we look around today (as opposed to, say, a week ago) we see that things can change in surprising ways. And the interest rate regime can change as well.
If you take the long term interest rate assumptions from JP Morgan, BlackRock, State Street, or Horizon, it looks like rates will stay low out 10 or 20 years. Everyone is entitled to their opinion, but as a risk person, I come back to, “who knows?“. That’s why it’s called risk.
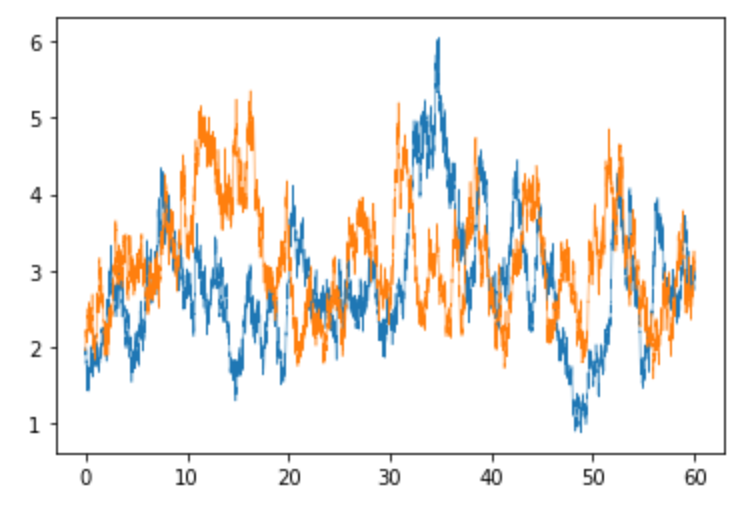
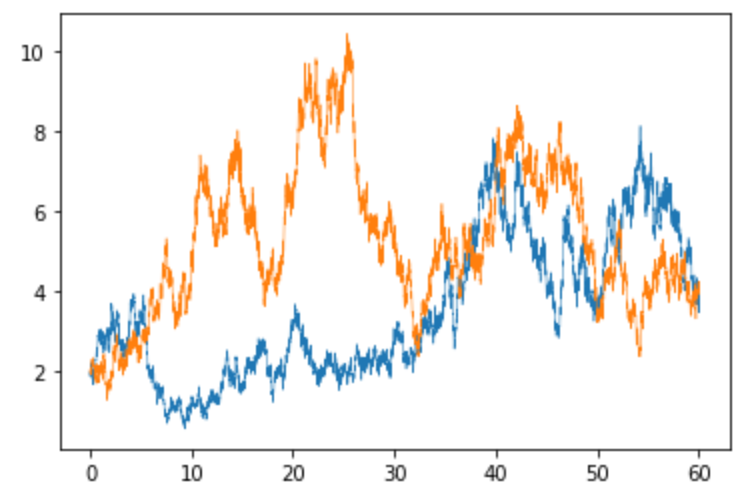
If you are developing a risk model for rates, the first thing you need to do is generate paths. The top chart is the rate myopia chart. It shows two sample paths for rates from a simulation assuming the future looks like the post-2008 period. The bottom one shows two paths from a simulation that uses the rate history over the past 60 years for its calibration.


Most people I talk to go with the post-2008 period. After all, think of all the weird stuff that happened before then. Take the 1970's to the early 1980s: War, inflation rolling into stagflation, oil crisis, change in Fed regime. Old history.
As we look out over the next decades, let’s take the idea of war, inflation, stagflation, oil and commodity scarcity, and a change in Fed policy away from QE off the table. Then, how bad can things possibly get? 😊
I have no specific opinion on where rates will be at any point in the future. But I would be remiss as a risk person to not concede that they can go quite high at some points over the next 60 years. Or that they can on average be higher than they have been in the recent past.
We have to model to include the case where rates can take a path with the sorts of extremes of the past 50 or 60 years. We’ve seen it; indeed, it is the only path we actually have seen. From a risk standpoint, it would be hard with a straight face to say, “Well, that is what really happened, but nothing like it will ever happen again”.
Access a better way to understand and work with risk, powered by MSCI’s factor model.

Rick Bookstaber
CO-FOUNDER AND HEAD OF RISK
Rick Bookstaber has held chief risk officer roles at major institutions, most recently the pension and endowment of the University of California. He holds a Ph.D. from MIT.
Access a better way to understand and work with risk, powered by MSCI’s factor model.
© 2022 Fabric Risk


