Low interest rates: Normal or Anomalous?
Over the past 30 years, we have seen a consistent downward trend in interest rates. But how anomalous is our current low interest rate environment? A multi-century dataset sheds new light to answer this question.
The decade following the Great Financial Crisis has been characterized by rather loose monetary policy accompanied by very low interest rates. The current low interest rate environment has been a feature of most advanced economies in the world. This follows a larger trend in the behavior of interest rates even before the GFC. Multiple theories have been proposed, most famously by Larry Summers under the name of Secular Stagnation, to explain this decades long trend following the high inflation period of the 1970s. These theories point to structural changes --- demographic changes, excess savings in the developed countries --- in the world economy that are claimed to be the core drivers of this trend. Implicit in discussions to explain suppressed interest rates is the assumption that our current low interest rate environment is somehow anomalous.
A recent paper from a Bank of England(BoE) researcher tries to challenge this assumption. By collecting archival material going back to the early 14th century, Paul Schmelzing shows empirically that interest rates globally show a decline that is consistent across countries, economics regimes, and political systems. In the paper titled "Eight centuries of global real interest rates, R-G, and the suprasecular decline, 1311-2018", Schmelzing shows that over 8 centuries there has been a consistent decline of 1.6 basis points per annum in global interest rates.

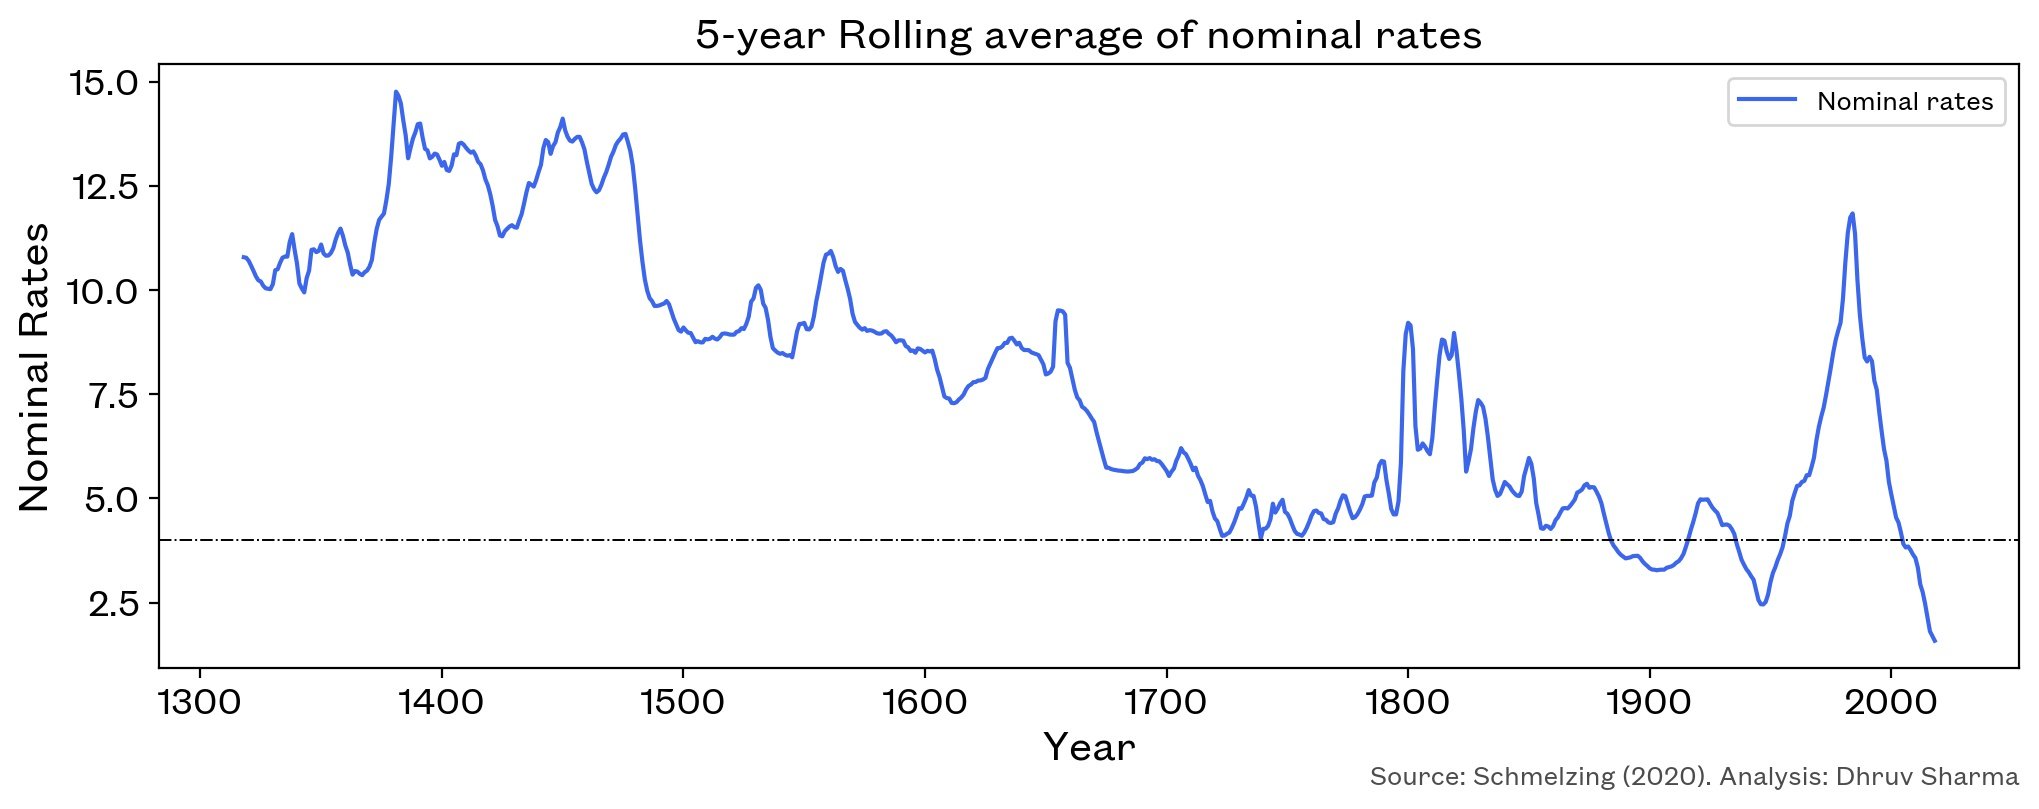
The central argument concerns real (inflation adjusted) rates. We will limit our analysis and comments to nominal rates. As shown in the graph above, the trend in rates has been somewhat consistent across different time periods. It is a remarkable finding given that the period considered spans everything from the Black Death, the fall of Constantinople, the discovery of the new world, the founding of the United States, the rise and fall of communism, and eventually to today. While there are periods within the data-set that show sharp shorter-term deviations from the trend, the truly provocative argument presented in the paper is that current rates are in fact consistent with a long-term "suprasecular" trend. Or as Schmelzing argues, "A Florentine trader in the 17th century would have been able to predict current low rates by looking if he had access to data from the preceding 3 centuries". It is to be noted that the data makes claims about long-term interest rates and is silent about the shorter end of the yield curve. Nonetheless, what lessons does it hold for the average investor.
Firstly, Schmelzing suggests that our current low-interest rate environment might not be anomalous at all. The data even suggests that the true outlier was the period in the 1970s and that the Volcker shock has only brought us back to trend. Secondly, and relatedly, the presence of the long term trend doesn't preclude periods of strong deviation away from it. Indeed, over shorter periods of a multi-century time-series we might see real rates rising. However, the paper argues, the long-term decline will eventually catch up with us.
While the argument from Schmelzing is persuasive, one might be inclined to consider more "recent" history, starting from the year 1700 onwards. Over the course of this more recent period, the trend has been muted and one observes interest rates hovering around 4% annually punctuated with periods of deviation (the period of the Napoleonic Wars around 1800 and more recently the decade of the 1970s). Hence, another reading of the data suggests that interest rates over the last 300 years or so have been mean-reverting in nature with the long-term mean around 4% (dotted horizontal line in the plot above).
Schmelzing's data series ends in 2018 and our experience with the post-Covid recovery present another argument for the paper's findings to be updated. A period of sustained inflation, as seen for the better part of 2021, might just mark a reversal of this trend. Last week's CPI numbers were the highest seen since 1982. And while the Fed has moved towards average inflation targeting and is willing to have inflation run beyond a fixed 2% target to make up for periods of under-target inflation, if we continue seeing high CPI numbers, it might push the Fed towards rate hikes. As discussed by Rick on a recent podcast appearance, investors need to be wary of losses even in relatively safe assets such as US treasuries.
Access a better way to understand and work with risk, powered by MSCI’s factor model.
© 2022 Fabric Risk


