Keep an Eye on Market Liquidity
Households are out over their skis. Sentiment and fundamentals are overheated. Concentration is high. A lot of risk potential. What could make it go wrong? In a word, liquidity.
Households are out over their skis in terms of risk exposure, with the percent of their liquid assets being held in stock at the highest level in recent years. Sentiment and fundamentals are overheated. There is concentration, with over 25% of the S&P 500 market cap in just ten stocks. (Make that nearly 50% for the NASDAQ).
A lot of risk potential. What could make it go wrong? In a word, liquidity. And right now things don’t look good on that score.
If investors reevaluate their risk tolerance, reassess fundamentals, or decide to push toward meaningful diversification, there will be a lot of stocks looking for a new home. If there is liquidity supply sitting in the wings, then everything will readjust without much panic. Plenty of exits, everyone walking out single file. If there is not enough “dry powder” at the ready, that is, not enough capital and willingness to employ that capital to soak up the liquidity demand, the exits can get jammed because of what is called a leverage-liquidity cycle.
Here is the dynamic of a leverage-liquidity cycle: A drop in prices creates a flurry of selling, usually forced selling because of margin calls for traders who are levered, but it can be algorithmic traders facing a sell rule, or investors who realize they are too exposed to the manifest market risk.
The sudden drop in prices poses an unknown for the markets, and as a result potential buyers scurry for the sidelines. So, liquidity drops. The drop in liquidity, coupled with ongoing selling in the face of lower prices, leads to further waves of selling, further price drops, and further reduction in liquidity supply. That is, there is a cascade down, a positive feedback loop passing between those who demand liquidity, to drops in prices, to drops in liquidity because of the drops in prices.
The pivot point for the feedback and cascade is liquidity. How much dry powder, how much capital at the ready.


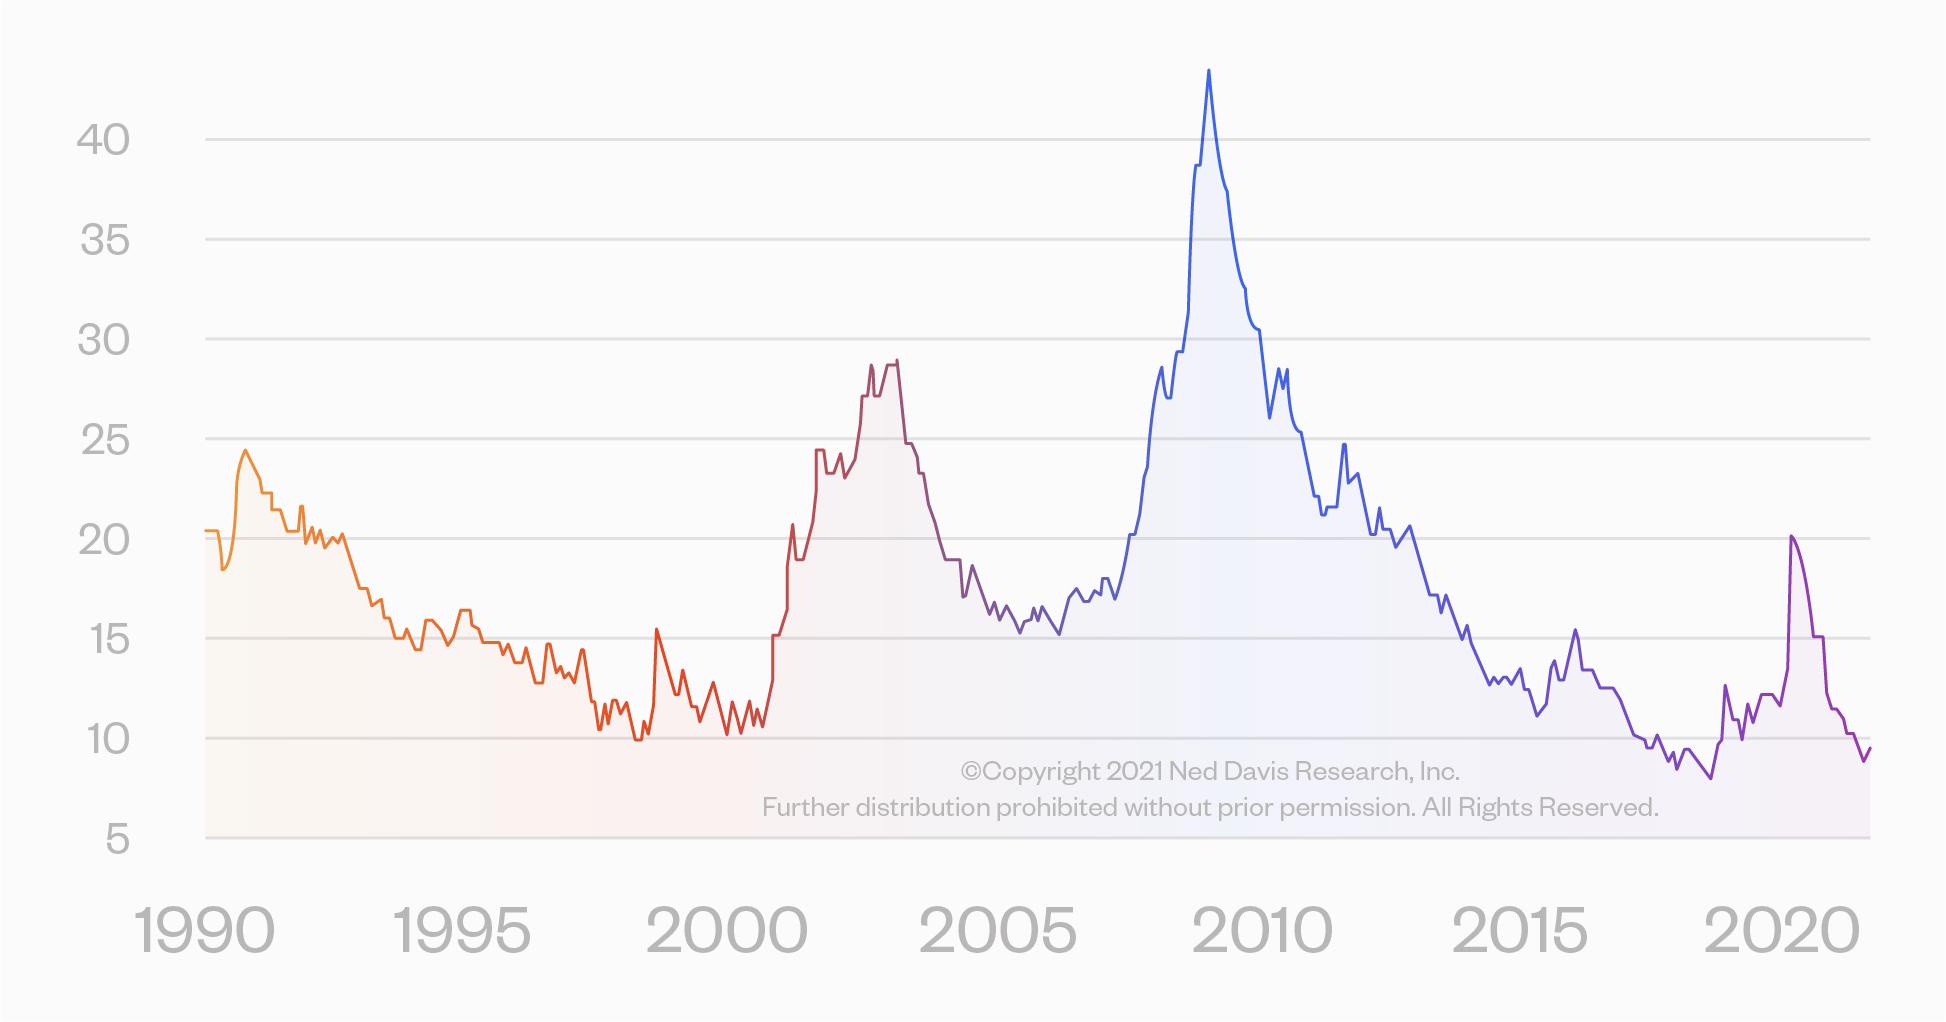
As the accompanying chart shows, based on a measure used by Ned David Research, right now liquidity is pretty much at the lowest point in the last thirty years. (Actually, I could go back forty years and it's the same.) That measure is the amount of money market assets as a proportion of total market assets. Think of it as the amount of dry powder for your cannons compared to the number of ships you might have to sink.
Three things about liquidity. It’s hard to measure. Its dynamics are even harder to model. And the effects of illiquidity are short-lived.
On point one, it is the toughest part of risk to uncover, because day-to-day you can’t really measure how deep liquidity is. Any more than you can look at people coming and going on a typical day if you want to get a sense for how jammed the exits to a building will be if there is a fire.
On modeling, the feedback between liquidity demand, prices, and liquidity supply is the essence of a complex dynamical system. A nice linear model won’t do the trick. We use a technology called agent-based models. If you’re interested in this, I have a recent book that goes through these models and why they are needed (without the need for any equations), The End of Theory (Princeton University Press, 2017).
On the last point, unlike being stuck in a burning building, if you have the staying power — like, you don’t have leverage that can force you out — you can sit tight. The leverage-liquidity dynamic is violent but short-lived. Once the smoke clears things tend to return to normal. Less those who got burned in the process.
Access a better way to understand and work with risk, powered by MSCI’s factor model.

Rick Bookstaber
CO-FOUNDER AND HEAD OF RISK
Rick Bookstaber has held chief risk officer roles at major institutions, most recently the pension and endowment of the University of California. He holds a Ph.D. from MIT.
Access a better way to understand and work with risk, powered by MSCI’s factor model.
© 2022 Fabric Risk


