

A simple question: How much worse are bear markets during recessions? It is more textured than it might seem.
Here is a chart that looks at bear markets from 1900 on, separating those that coincided with a recession from those that didn’t. (Recession drops are red dots, non-recession drops green dots.)
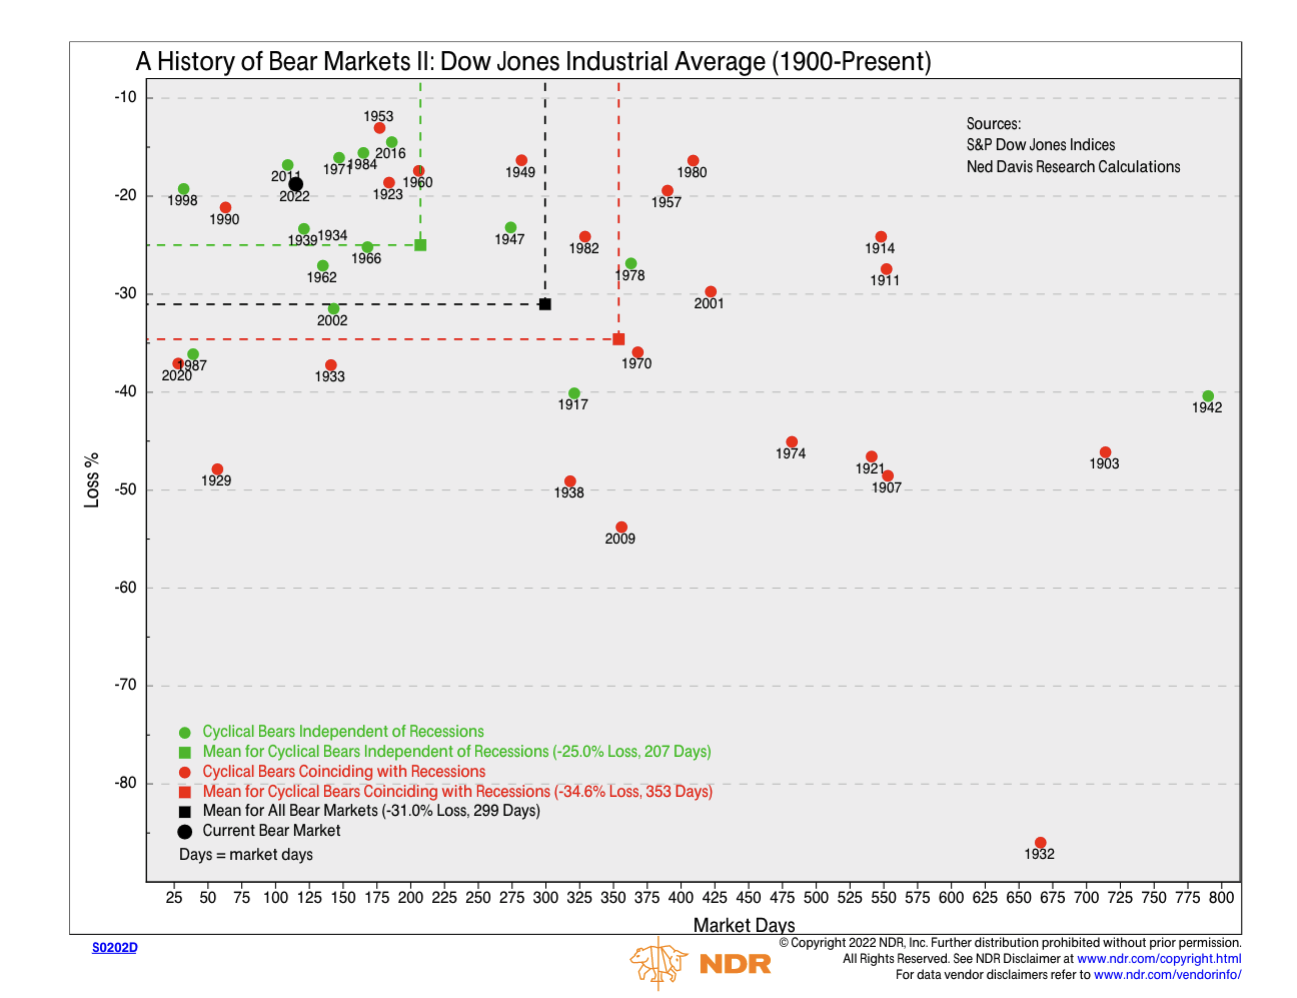
The average drop is 31% with a recession and 25% without. And the time to recover is 353 days versus 299 days. The average days to recover is highly skewed for recessions; like, all over the place. Recession turbocharges the uncertainty.
To me that is the most interesting part of the chart: if you have a bear market coinciding with a recession, the envelope of possible paths is much wider, the timing and depth is much harder to pin down. Put another way, the market is more vulnerable.
But for markets, time matters
And the most important takeaway is that market drops are not point estimates. They are distributions. You can’t say, “If such and such occurs, the market will drop 25%“. Although that is what all the risk systems do. They show the result of a scenario as a bar chart; equities will drop 25%, bonds 12%, and so on.
You also are missing half of the story if you act like the drop just happens and that is that. It matters how quickly it drops, and how long it takes to recover. That is, there is a time dimension. For financial advisors and their clients, this is critical information.
What I do at Fabric is create a response envelope like the one below, so I can look at the range of paths the scenario might take — the time to drop, the amount of the drop, and the time to recover. And that is all conditioned on market vulnerability. One aspect of vulnerability, as we see here — and as is pretty intuitive — is that the market is more vulnerable in the outset of recession.
Using our risk model at Fabric, this figure gives a picture of the stagflation scenario. It shows a few paths — actually, there are many simulation paths, but I pare it down here because if you put them all in it is hard to see what is going on. The general sense of risk is a market down another 25% to 30%, with a drop taking over a year, and a year or more to recover. (It is pegged with a start of 2022, but we actually don’t know when the “if” will start.)
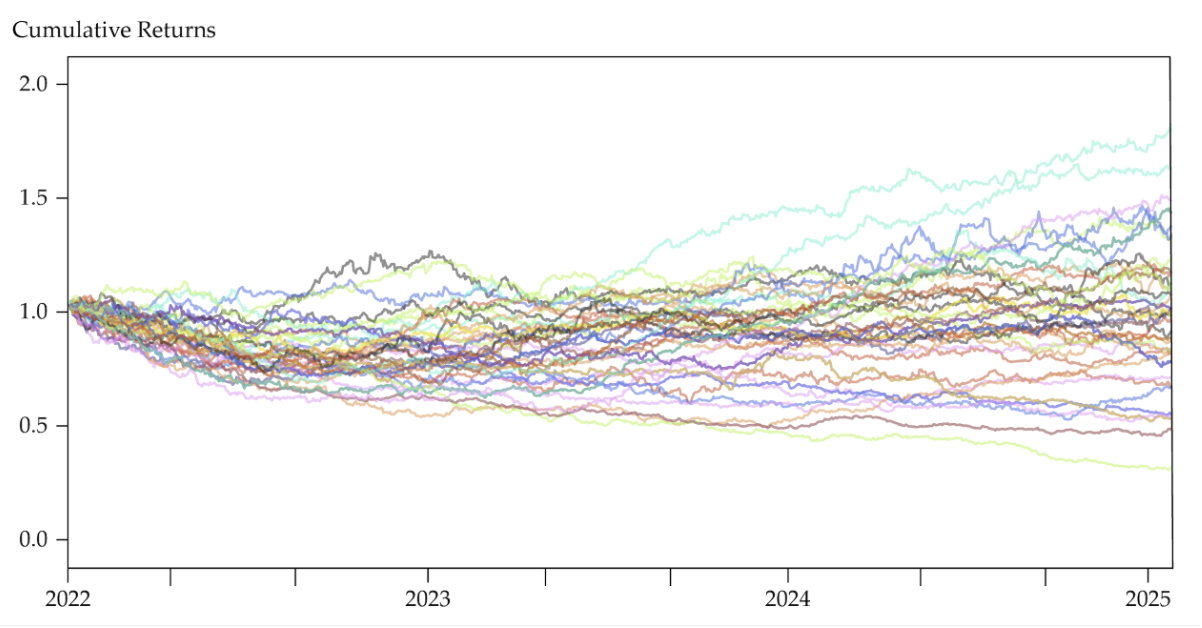
A key point for any scenario: It is not a number, it is a cloud. It is not a matter of “the market will drop 30%“. There is a range of possible drops, there is a range of possible times to the drop, and there is a range of possible times to recover. That is why it is a risk.
For bear markets, there is no one market
Not only is time a dimension that we need to consider when looking at how the market might behave during a recession. We also have to realize that there is no “market”. Different parts of the market will behave differently.
To do this, we look at scenarios using risk factors. Why factors? Because there are few “pure” stocks. Stocks are affected by many factors. Those that are within, say, the consumer durables sector might also be affected by energy, or by China. Or take Amazon. It is in retail, but has a high factor loading to technology because of its cloud services.
There is an array of risk factors — multidimensional across sectors, countries, and investment styles. Every scenario affects risk factors differently. Every asset is affected differently by each of these factors, and every portfolio — including any index — is built up lego-like from these.
So a better question to ask is: What risk factors will be most affected? And then ask, how exposed is my portfolio to these factors?
It is one of the great advantages of posing risks in factor space and then seeing how those factors feed through to assets, rather than trying to look at risk directly with assets. I’ve made this point elsewhere; it is central to how we develop scenarios at Fabric. It is why we look at our relationship with MSCI and our ability to use their Multi-asset factor model as being so valuable for risk assessment.
Example using factors to assess the market dimension
In a previous commentary, I used inflation as an example here. We’d expect basic materials to be less affected by inflation than downstream product like retail. We’d also expect real estate and mortgages to be adversely affected because inflation leads to higher nominal rates.
We have the benefit of hindsight to see if such intuition is correct. The bar chart gives a sense of this using MSCI’s Multi-asset factor model that is at the core of our risk factor approach. Since the start of the year, we see that oil and gas, chemicals, and metals factors all do well. Real estate and mortgages, and retail and consumer durables factors, which are at the end of the supply chain, do poorly.
.png?width=2625&name=Returns%20of%20MSCI%20Risk%20Factors%20for%20Inflation%20Scenario%20(%25YTD).png)
The result is different behavior for different stocks in the throes of the scenario. Look at these two ETFs, one for energy and one for consumer discretionary. Just as the factors vary, so do the stocks and the portfolios with high loadings in the various factors.
.png?width=668&name=iShares%20MSCI%20Global%20Energy%20ETF%20(Price).png)
.png?width=671&name=SPDR%20Consumer%20Discretionary%20ETF%20(Price).png)
The chart is focused on industry factors; there also are country and style factors, and the story will be the same there. For example:
▪️Companies with high leverage will be in the negative territory. Leverage looks at long-term debt, but we can assume a need to roll it, and it will be done at a higher cost, both due to rates and credit spreads.
▪️Size is a positive. Higher size means more market power, and so costs can be kept down, and in some cases price can be raised. Low size means cost takers. So hurt more
▪️Value is a negative. This is a little iffy. My argument is that value often means brick and mortar, and a cost structure wedded to real factors of production. By contrast, high growth tends to be biased toward companies driven by intangibles.
▪️Some argue that growth is hurt because high rates discount earnings further out.
▪️Emerging markets is a positive. Another bit of a reach. But EM tend to be commodity producers, and the ultimate end of the supply chain is insulated from inflation.
The point is that scenarios don’t affect “the market”. Each scenario will affect different parts of the market, based on how these factors respond to the scenario and based on the stock’s loading on different risk factors.


